> ## Documentation Index
> Fetch the complete documentation index at: https://sequinstream.com/docs/llms.txt
> Use this file to discover all available pages before exploring further.
# Metrics
> Reference for Sequin's metrics. Use metrics to monitor health and performance.
Sequin exposes a metrics endpoint, using Prometheus text format, which can be integrated into your existing observability workflows. By default, this endpoint is at `/metrics` on port `8376`.
For production deployments, consider securing the metrics endpoint with HTTP Basic Authentication.
Set `SEQUIN_METRICS_USER` and `SEQUIN_METRICS_PASSWORD` environment variables and Sequin will automatically require these credentials. See the [Configuration](/reference/configuration) reference for details.
Metrics are designed to answer:
* Is Sequin keeping up with the database? (Ingestion metrics)
* Is Sequin processing messages quickly? (Internal processing metrics)
* Are sinks keeping up with Sequin? (Delivery metrics)
* Is the Sequin service experiencing CPU or memory pressure? (VM metrics)
 ## Metrics reference
### Ingestion metrics
* `sequin_ingestion_latency_us` (Gauge)
Measures latency between transaction commit and when Sequin first receives it. Calculated by instrumenting Sequin's own heartbeat messages.
* `sequin_messages_ingested_count` (Counter)
Number of messages Sequin has received from a given replication slot.
* `sequin_replication_slot_size_mb` (Gauge)
Size of the Postgres replication slot in megabytes, calculated via:
```sql theme={null}
select pg_wal_lsn_diff(pg_current_wal_lsn(), confirmed_flush_lsn) as replication_lag_bytes
from pg_replication_slots
where slot_name = $1;
```
Indicates how much WAL has accumulated for the slot, helping determine if Sequin is keeping up with the database.
### Internal processing metrics
* `sequin_internal_latency_us` (Histogram)
Measures time between Sequin ingesting a message and beginning to process it.
### Delivery metrics
* `sequin_delivery_latency_us` (Histogram)
Measures time between Sequin beginning to deliver a message and a given sink's successful acknowledgement. Some sinks are able to batch messages, in which case this metric measures the batch latency, rather than the per-message latency.
* `sequin_message_deliver_attempt_count` (Counter)
Incremented for each message Sequin tries to deliver, before receiving a success or failure response.
* `sequin_message_deliver_success_count` (Counter)
Incremented for each message that Sequin successfully delivers.
* `sequin_message_deliver_failure_count` (Counter)
Incremented for each message that Sequin fails to deliver to a sink. This is because the sink was either unreachable, timed out, or returned an error.
### Total latency
The total latency from database commit to message delivery is the sum of the ingestion latency, internal processing latency, and delivery latency.
### VM metrics
Sequin is implemented with Elixir. Elixir's VM (the BEAM) exposes many metrics. The following are the ones we find most useful for monitoring Sequin:
* `erlang_vm_statistics_reductions_total` (Counter)
Measures how many VM instructions are executed across all processes.
Shows intensity of CPU-bound work.
Recommend using with a rate query rather than directly.
* `erlang_vm_memory_bytes_total` (Gauge)
Memory usage of the entire VM.
### Entity health
* `sequin_entity_health` (Gauge)
Tracks the health status of various Sequin entities (sinks, databases, and replication slots).
Labels:
* `entity_type` - Type of entity (`sink`, `database`, `replication_slot`)
* `entity_id` - UUID or name of the entity
* `status` - Current status label (`ok`, `warn`, `error`, `paused`)
Status values:
* `ok` - Entity is healthy and operating normally
* `warn` - Entity has warnings but is still operational
* `error` - Entity is experiencing errors and may not be functional
* `paused` - Entity is intentionally paused or disabled
Example scrape:
```
sequin_entity_health{entity_type="sink",entity_id="acme_kafka",status="ok"} 1
sequin_entity_health{entity_type="sink",entity_id="acme_kafka",status="warn"} 0
sequin_entity_health{entity_type="sink",entity_id="acme_kafka",status="error"} 0
sequin_entity_health{entity_type="sink",entity_id="acme_kafka",status="paused"} 0
```
Example PromQL for alerting on error:
```
sequin_entity_health{status="error"} == 1
```
Example Grafana panel query to count entities in error state:
```
sum(sequin_entity_health{status="error"} == 1)
```
## Grafana dashboard
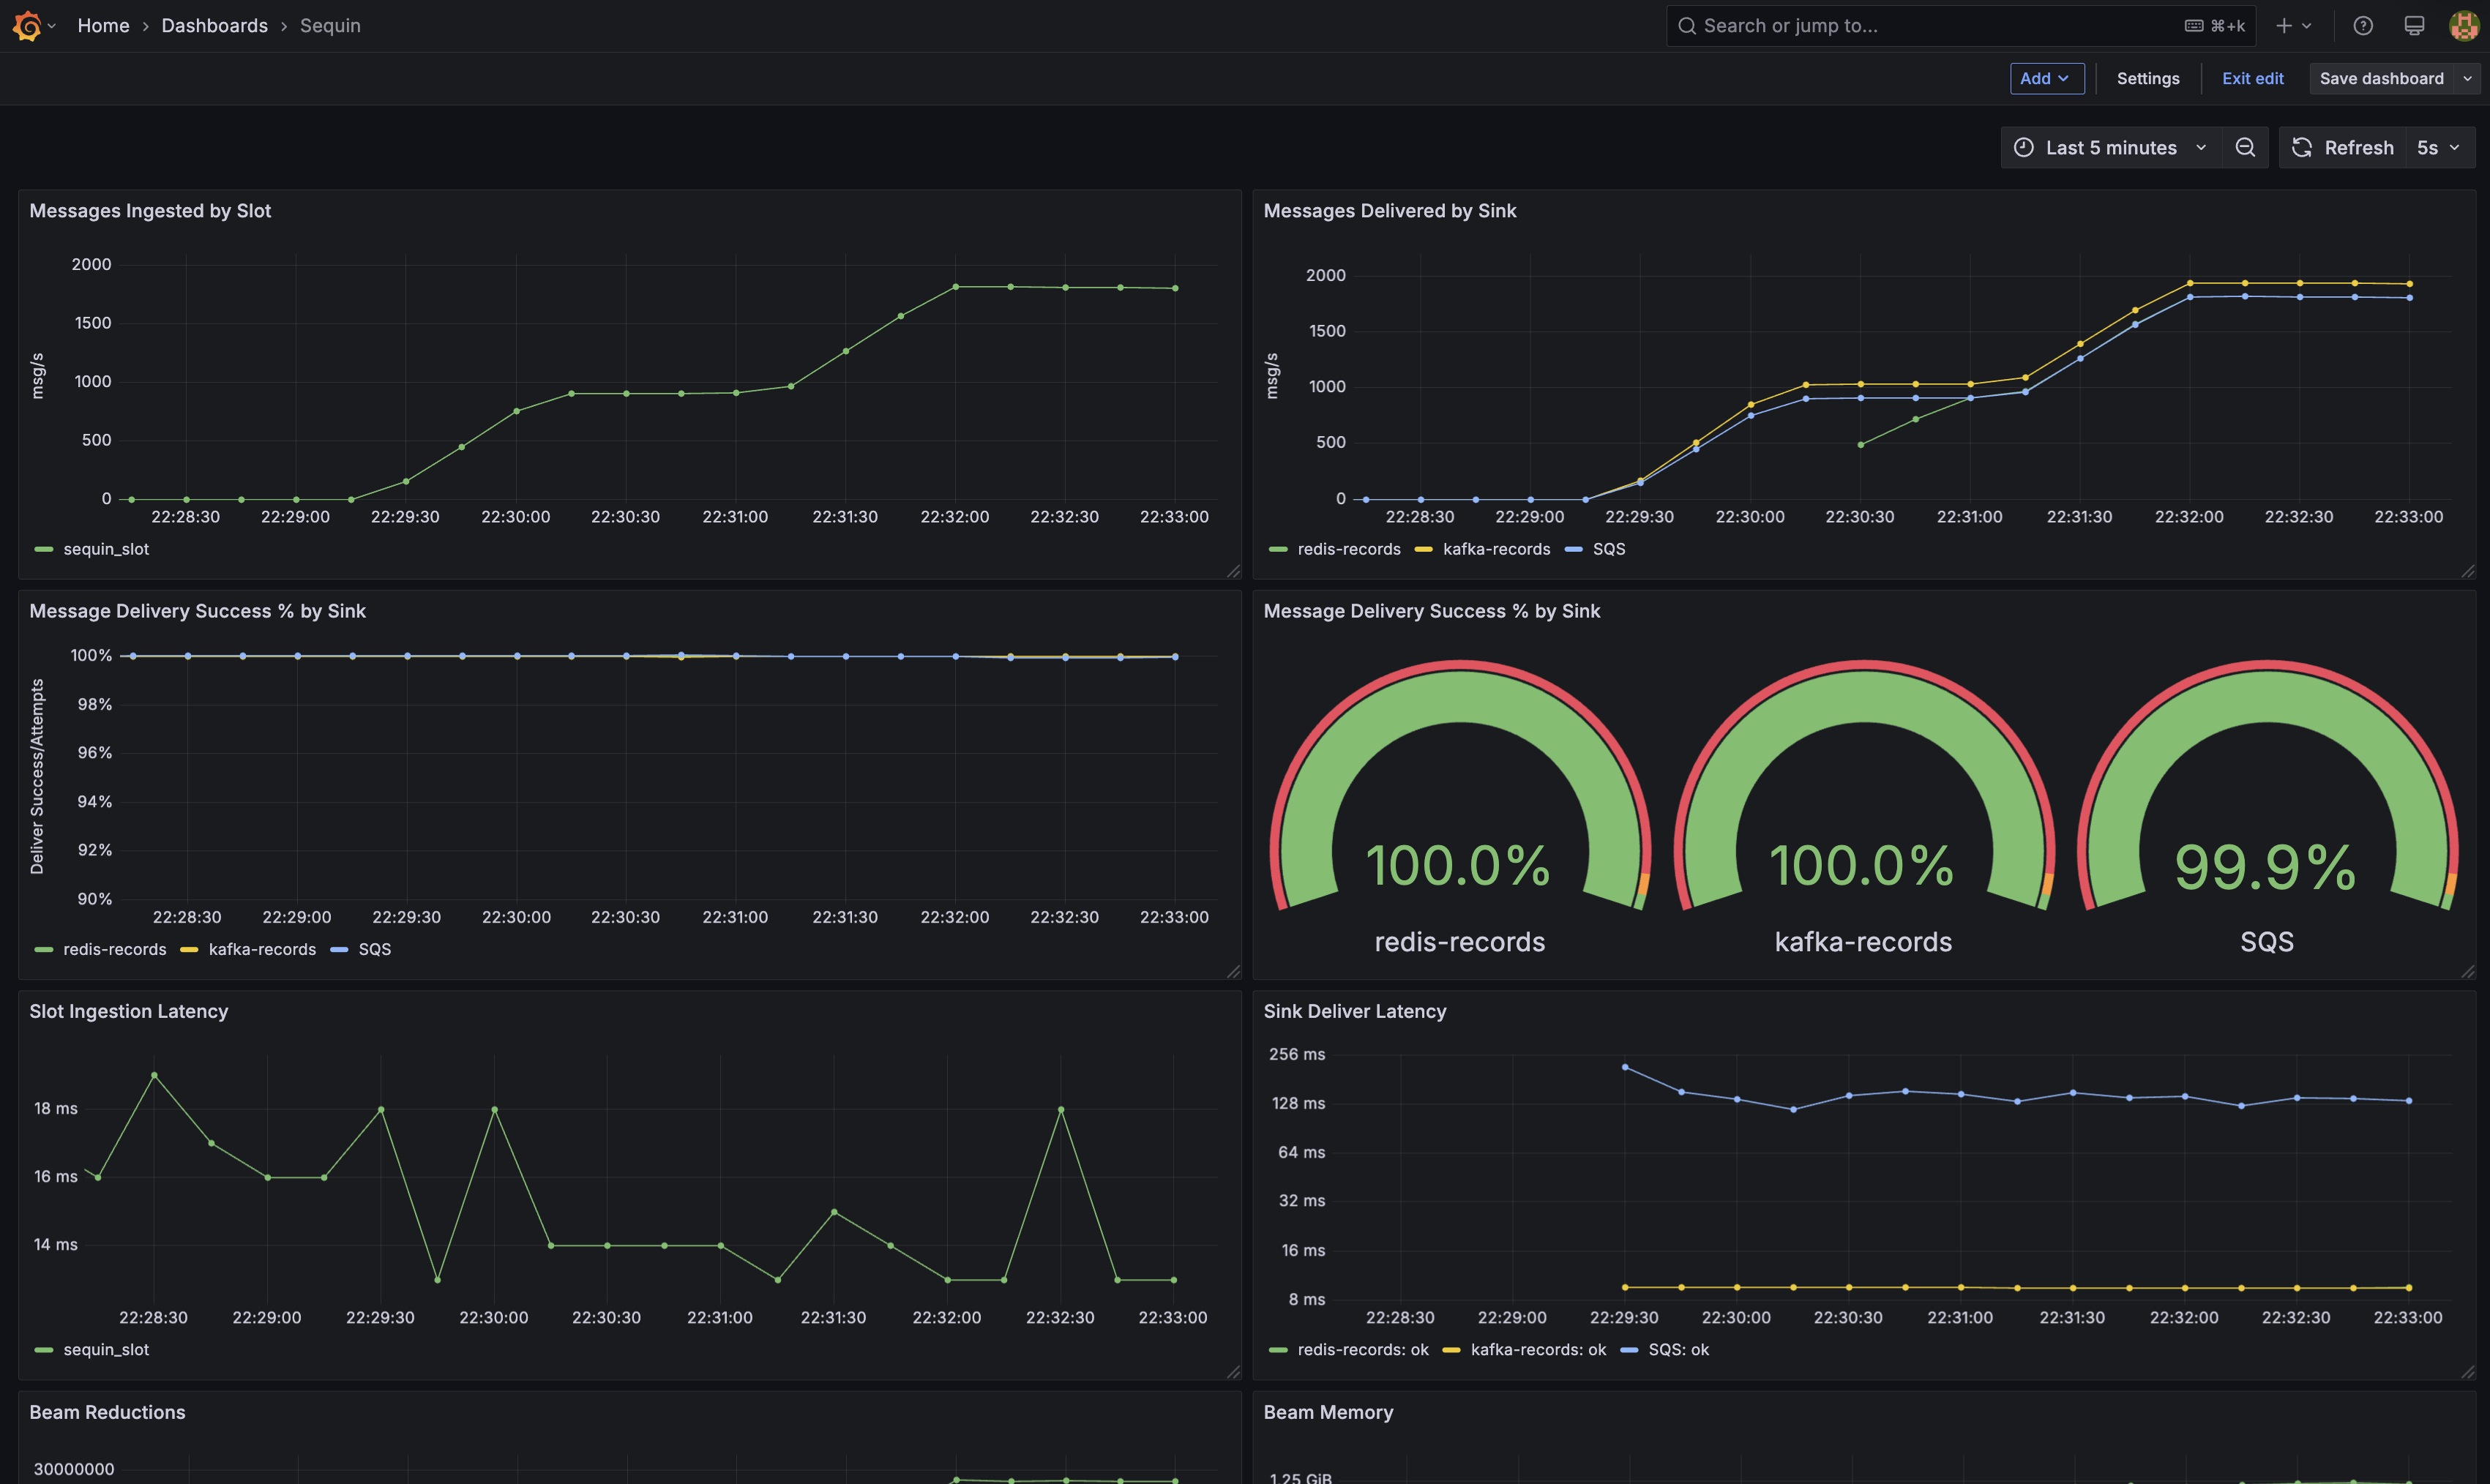
Sequin provides a [Grafana dashboard template](https://github.com/sequinstream/sequin/blob/main/docker/dashboard.json) for monitoring Sequin. This can be imported directly into your Grafana instance for use, or referenced as a guide for building your own.
## Metrics reference
### Ingestion metrics
* `sequin_ingestion_latency_us` (Gauge)
Measures latency between transaction commit and when Sequin first receives it. Calculated by instrumenting Sequin's own heartbeat messages.
* `sequin_messages_ingested_count` (Counter)
Number of messages Sequin has received from a given replication slot.
* `sequin_replication_slot_size_mb` (Gauge)
Size of the Postgres replication slot in megabytes, calculated via:
```sql theme={null}
select pg_wal_lsn_diff(pg_current_wal_lsn(), confirmed_flush_lsn) as replication_lag_bytes
from pg_replication_slots
where slot_name = $1;
```
Indicates how much WAL has accumulated for the slot, helping determine if Sequin is keeping up with the database.
### Internal processing metrics
* `sequin_internal_latency_us` (Histogram)
Measures time between Sequin ingesting a message and beginning to process it.
### Delivery metrics
* `sequin_delivery_latency_us` (Histogram)
Measures time between Sequin beginning to deliver a message and a given sink's successful acknowledgement. Some sinks are able to batch messages, in which case this metric measures the batch latency, rather than the per-message latency.
* `sequin_message_deliver_attempt_count` (Counter)
Incremented for each message Sequin tries to deliver, before receiving a success or failure response.
* `sequin_message_deliver_success_count` (Counter)
Incremented for each message that Sequin successfully delivers.
* `sequin_message_deliver_failure_count` (Counter)
Incremented for each message that Sequin fails to deliver to a sink. This is because the sink was either unreachable, timed out, or returned an error.
### Total latency
The total latency from database commit to message delivery is the sum of the ingestion latency, internal processing latency, and delivery latency.
### VM metrics
Sequin is implemented with Elixir. Elixir's VM (the BEAM) exposes many metrics. The following are the ones we find most useful for monitoring Sequin:
* `erlang_vm_statistics_reductions_total` (Counter)
Measures how many VM instructions are executed across all processes.
Shows intensity of CPU-bound work.
Recommend using with a rate query rather than directly.
* `erlang_vm_memory_bytes_total` (Gauge)
Memory usage of the entire VM.
### Entity health
* `sequin_entity_health` (Gauge)
Tracks the health status of various Sequin entities (sinks, databases, and replication slots).
Labels:
* `entity_type` - Type of entity (`sink`, `database`, `replication_slot`)
* `entity_id` - UUID or name of the entity
* `status` - Current status label (`ok`, `warn`, `error`, `paused`)
Status values:
* `ok` - Entity is healthy and operating normally
* `warn` - Entity has warnings but is still operational
* `error` - Entity is experiencing errors and may not be functional
* `paused` - Entity is intentionally paused or disabled
Example scrape:
```
sequin_entity_health{entity_type="sink",entity_id="acme_kafka",status="ok"} 1
sequin_entity_health{entity_type="sink",entity_id="acme_kafka",status="warn"} 0
sequin_entity_health{entity_type="sink",entity_id="acme_kafka",status="error"} 0
sequin_entity_health{entity_type="sink",entity_id="acme_kafka",status="paused"} 0
```
Example PromQL for alerting on error:
```
sequin_entity_health{status="error"} == 1
```
Example Grafana panel query to count entities in error state:
```
sum(sequin_entity_health{status="error"} == 1)
```
## Grafana dashboard
Sequin provides a [Grafana dashboard template](https://github.com/sequinstream/sequin/blob/main/docker/dashboard.json) for monitoring Sequin. This can be imported directly into your Grafana instance for use, or referenced as a guide for building your own.